Image: Flickr / Wikimedia Commons / Unsplash
Visual Search Finally Shows Up in Search Console, Minus the Queries
Google now separates Lens and Circle to Search traffic from regular web results. The report shows which pages won but never what people photographed, so the analysis has to start from the page.
Image: Flickr / Wikimedia Commons / Unsplash
This article contains an affiliate link. AI Eating The World may earn a commission on qualifying purchases, at no extra cost to you.
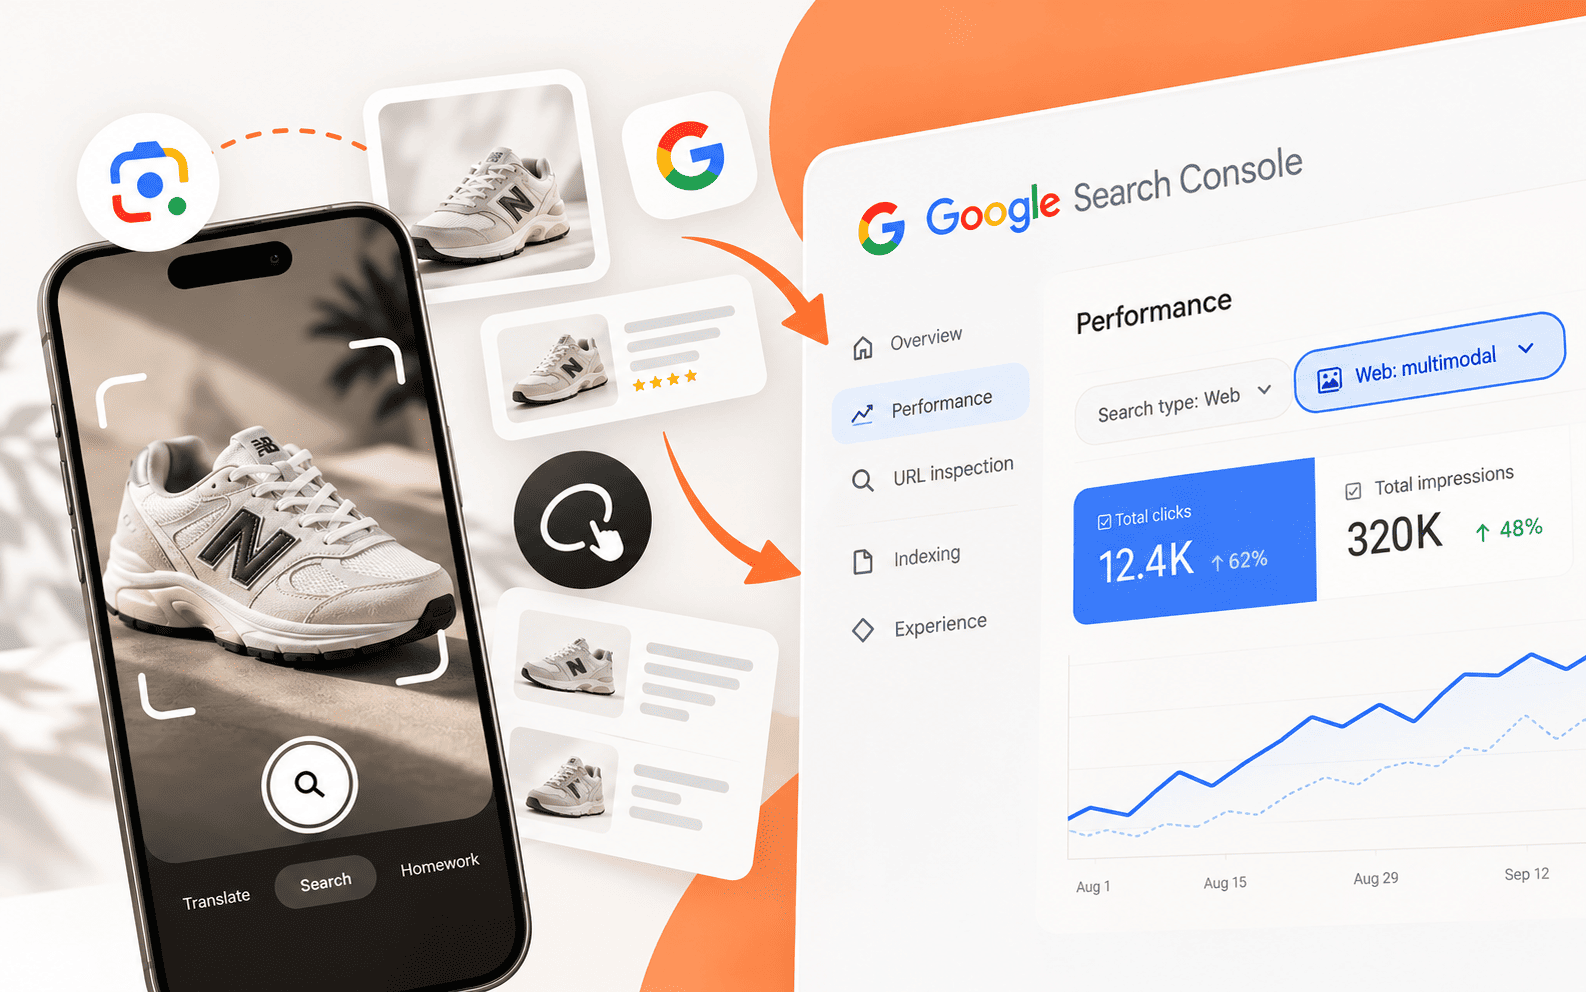
Search Console's new Web: multimodal filter reports visual search traffic from Google Lens, Circle to Search and image uploads for the first time. It shows clicks and impressions by page but no queries, so teams have to work backward from the pages that win.
What the new visual search filter in Search Console reports
On September 24, 2026, Google gave visual search its own line in Search Console. The Performance report's Web search type now splits in two: Web: text-based, for queries typed into the search bar, and Web: multimodal, for searches where someone used an image. Google's announcement says the multimodal bucket covers Google Lens, Circle to Search on Android, images uploaded to Google Search and Chrome's right-click "Search this image" option.
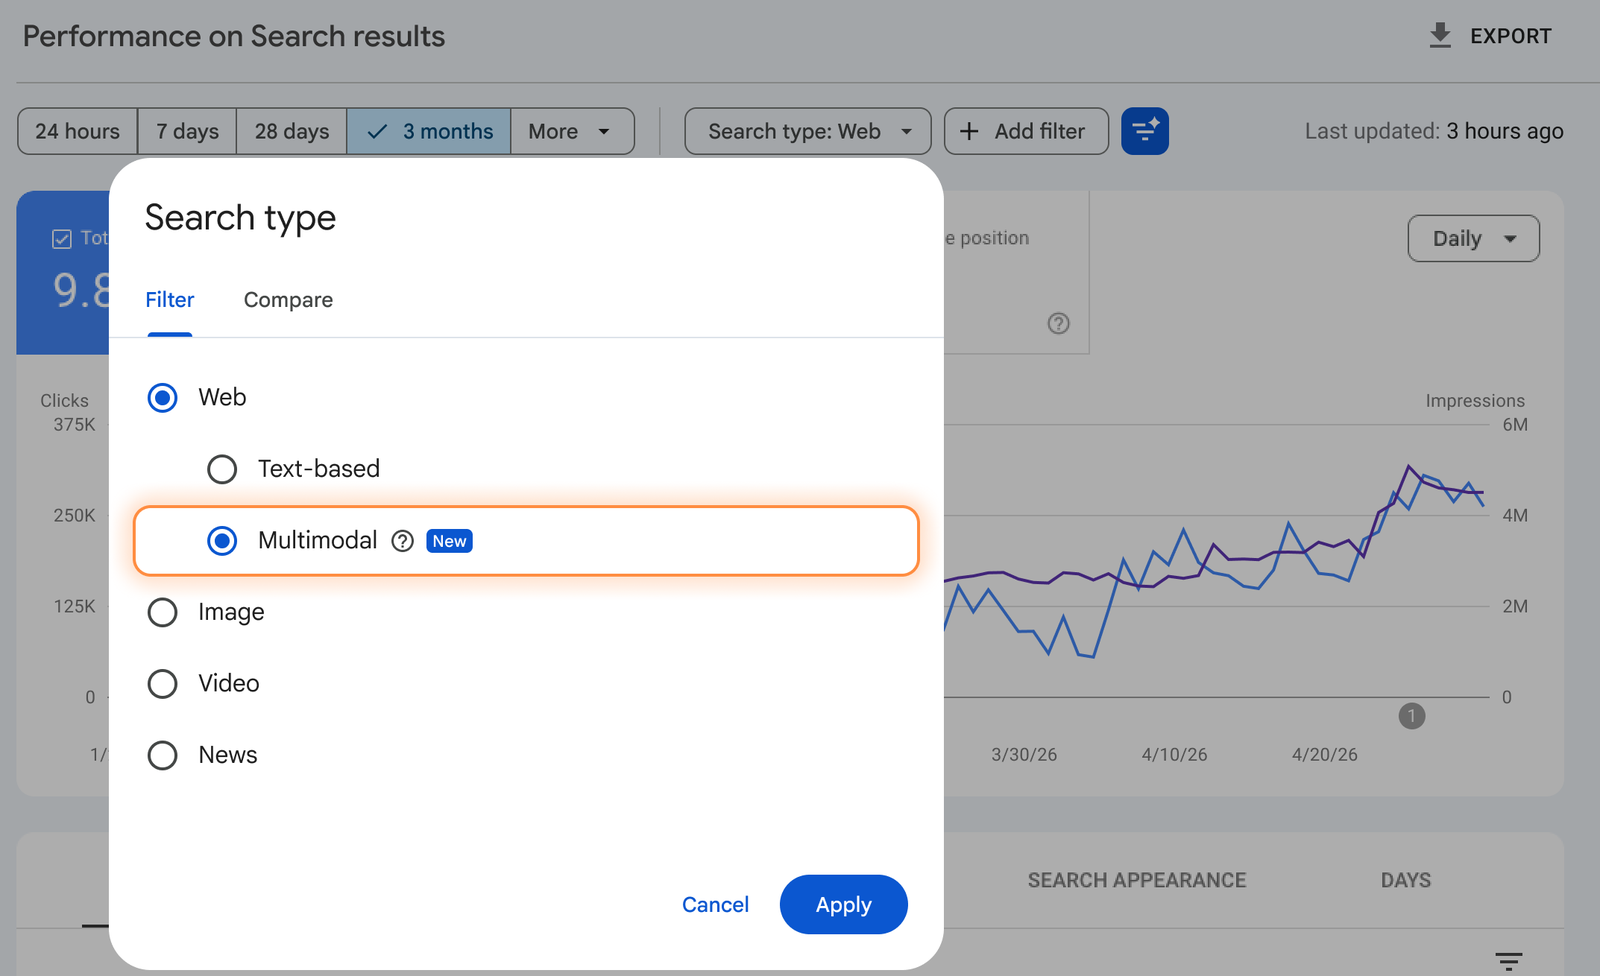
Those clicks used to be counted as ordinary web traffic, so a site could have been earning them for years without anyone on the team noticing. The same filter also appears in the Generative AI features report. Google is rolling it out globally, and the numbers only appear for sites that actually get traffic from image searches.
The volume behind the filter is large. In October 2024, Google said Lens was handling nearly 20 billion visual searches a month and that 20% of them were shopping related. For US retailers, parts suppliers and how-to publishers, that's a discovery channel that has been running with no measurement at all.
The blind spot: visual search traffic with no queries
Switch to the multimodal view and you get clicks, impressions, click-through rate and average position, broken down by page, country, device and date. The Queries tab isn't available. Google's help page, as quoted by Search Engine Journal, explains why: "Because multimodal searches mostly use images rather than text, specific text query data isn't available for this traffic."
That follows from how a Google Lens search works. The query is a photo of a sneaker someone saw on the subway, or a screenshot of a chart, or the label on a water heater. There's no keyword to report. For teams whose reporting starts from keywords, the first question they'd normally ask, what did people search for, has no answer in this report.
Exports have a gap as well. The Search Analytics API lists web, image, video, news, Discover and Google News as search types, with no separate multimodal value, so a dashboard that pulls Search Console data through the API can't split the two yet. Until that changes, the Export button in the report is how you get the data out. Google also hasn't said whether the multimodal view includes data from before launch day.
Early numbers from individual sites are small and uneven. Christian Ott of seo-kreativ.de published his site's first two weeks: 407 multimodal impressions and 2 clicks between September 10 and 21, against 201,457 impressions and 410 clicks from text search over the same days. 89% of the multimodal impressions came from phones, compared with 22% for text. Ott says plainly that the figures come from one site and don't make a rule, and the same caution applies to every early benchmark published this fall.
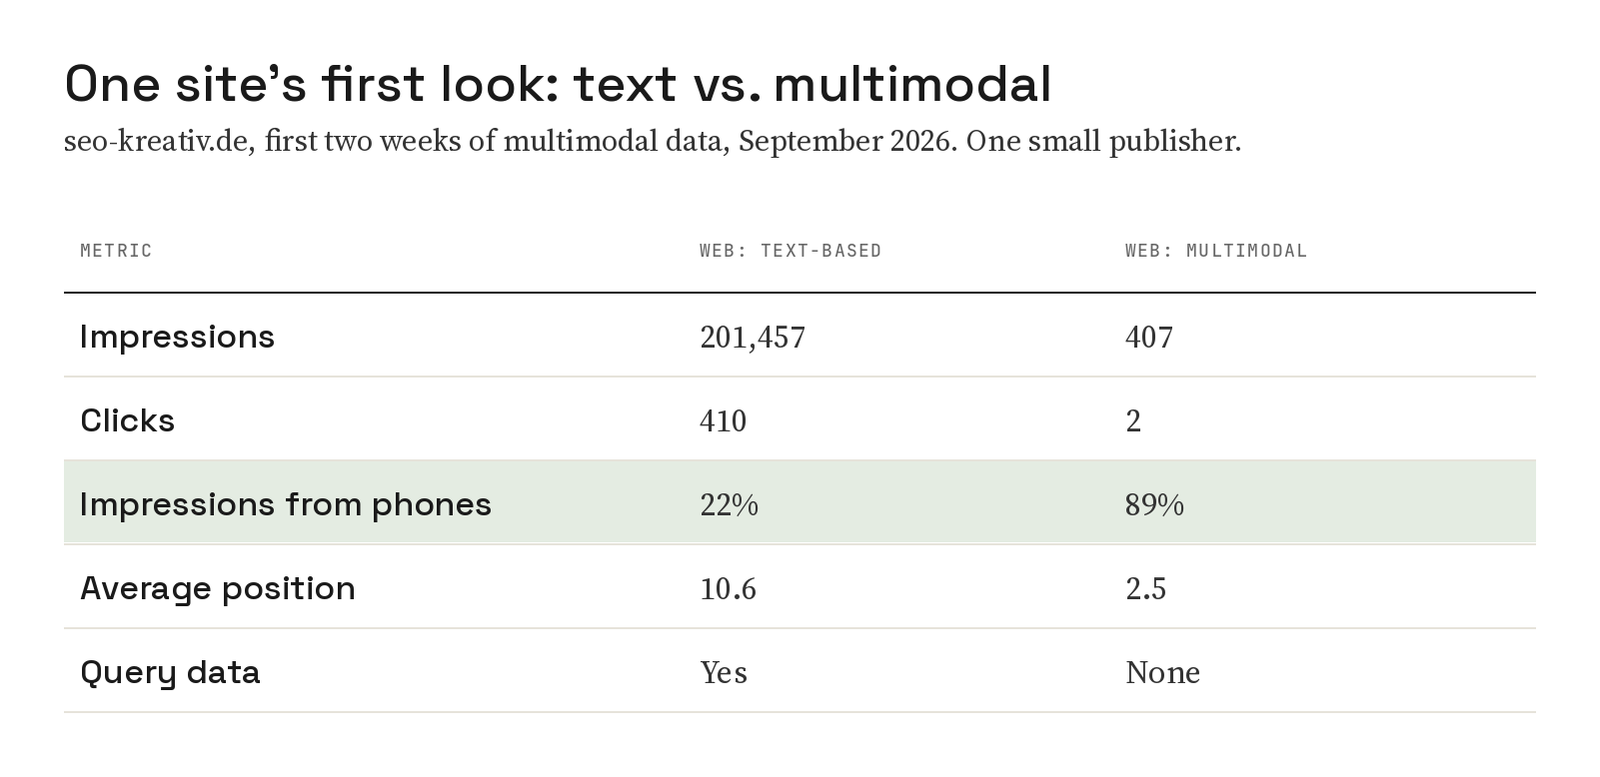
An SEO blog is close to the worst case for this channel, because few people point a camera at an article about AI Overviews. Stores that sell sneakers, furniture or replacement parts are the sites where shoppers take photos, so their share is likely to be larger. Your own split is the number that matters, and pulling it takes about five minutes.
Working backward from the pages visual search picked
With no queries, the usual workflow runs in reverse. You don't start with a keyword and look for the page that should rank. You start with the pages Google matched to a photo and work out what the person was probably pointing their camera at.
Pull a baseline first. In the Google Search Console performance report, set the search type to Web: multimodal, open the Pages tab and export a few weeks of data, then export the same view for text-based traffic so you can compare page by page. Mark September 24 on any chart you share with a client or your boss, since Google hasn't said how the split affects comparisons with older web totals.
Then sort your pages into groups. Pages that earn both text and multimodal impressions show you what already works. Pages with multimodal impressions but little text traffic show you demand that keyword research missed. Pages that do well in text search but never appear in multimodal results are where you have the most room to test.
Open each page in the first two groups and look at it the way a camera would. Which image on it could a photo plausibly match: a product shot, the packaging, a diagram, a screenshot of an app? Google's image SEO documentation covers what makes those images easy for a visual search engine to match. Use standard HTML img elements, because Google doesn't index CSS background images. Write image alt text that describes the picture in context without stuffing keywords into it, give files descriptive names, and place images next to text about the same subject.
Test one template at a time. Replace a stock photo with original shots of the product from several angles, rewrite vague alt text, or move the main image next to the product name and add the image property to the page's structured data. Compare multimodal clicks over four weeks against similar pages you left alone. It's a slower loop than keyword tracking, and for now it's the only one this report supports.
Sources for this section
Adding the context Search Console leaves out with Semrush One
Search Console tells you which pages visual search picked. It can't tell you how those pages rank in text search, which technical issues they carry or how they compare with a competitor's pages. We fill that gap at AETW with Semrush, the SEO platform we use for keyword research and site audits. If you want to run the steps below on your own site, start a 7-day free trial of Semrush One and connect Search Console on day one.
Semrush One bundles the Semrush SEO Toolkit and the AI Visibility Toolkit in one subscription. For a report with no queries, four tools in the SEO Toolkit do most of the work.
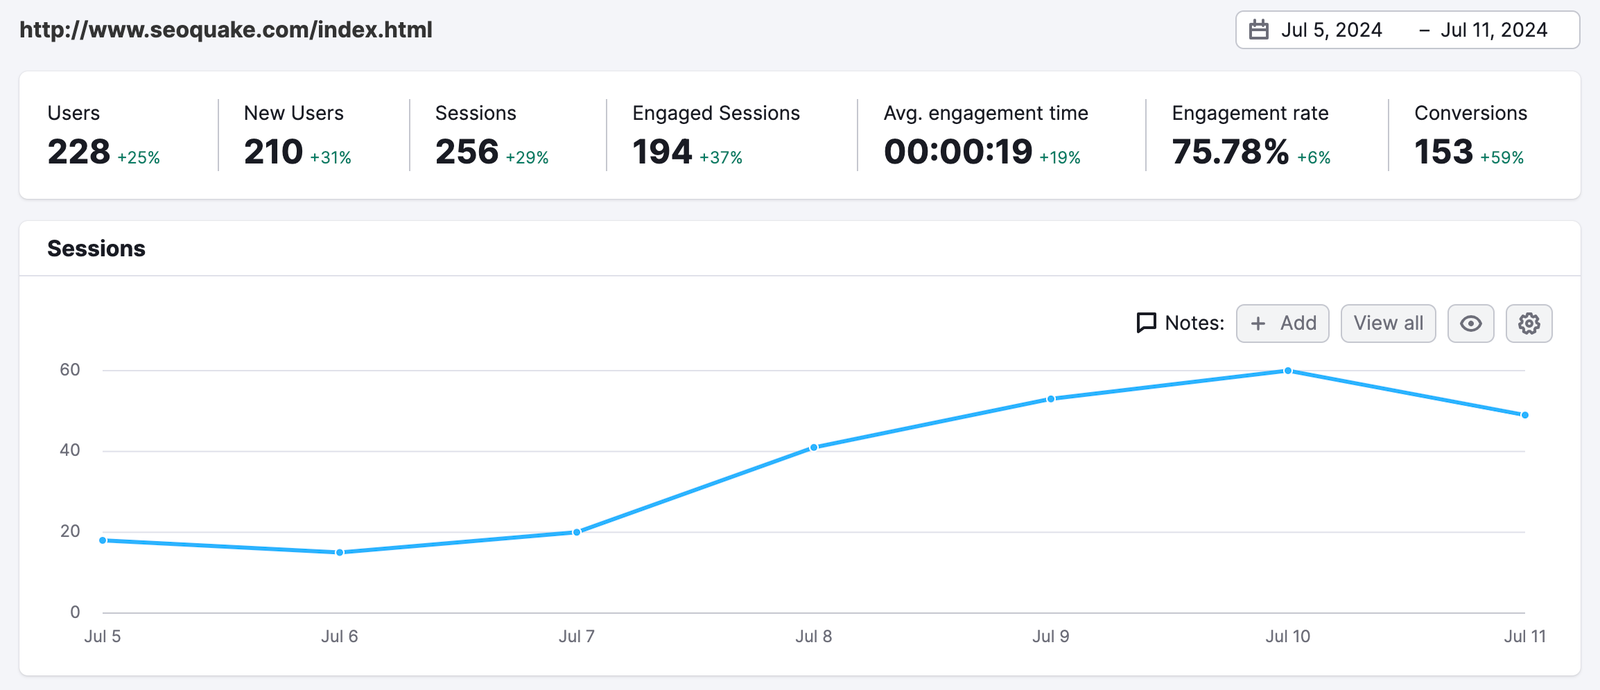
Organic Traffic Insights connects Google Analytics and Search Console to Semrush's keyword data and maps keywords to landing pages. Open a page that earns multimodal impressions and you see its users, sessions, engagement and conversions, along with the text keywords it ranks for from both Semrush and Search Console. For a page whose visual queries are hidden, that's the nearest thing to context you'll get.
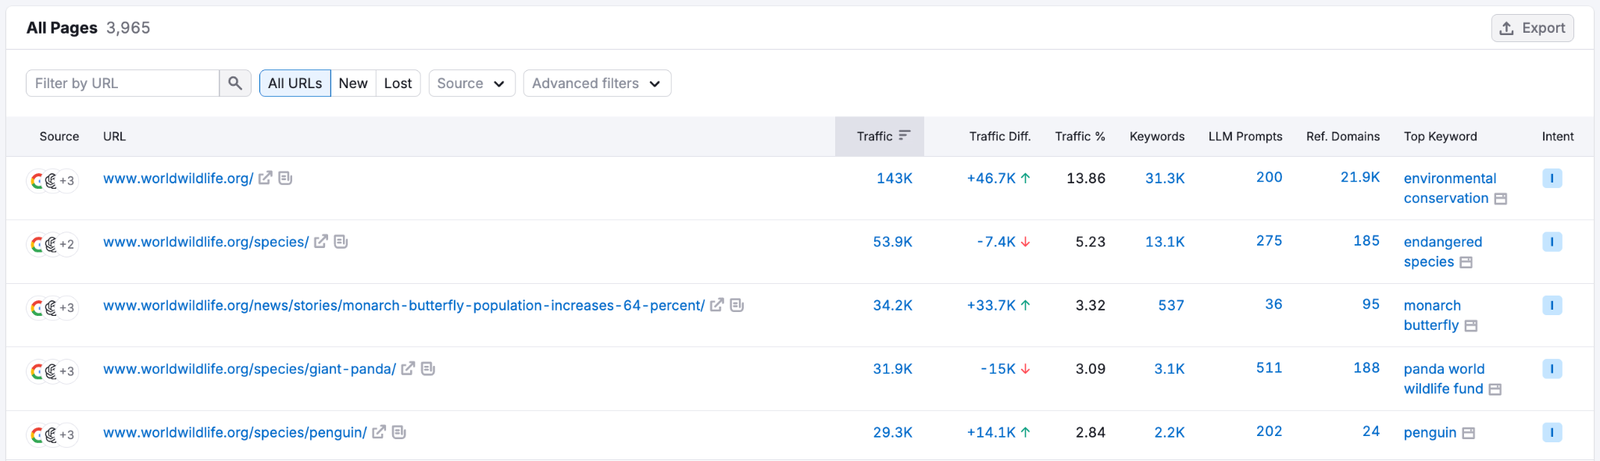
The Top Pages report shows how every URL on a domain performs across organic search, AI Overviews, AI Mode, ChatGPT and Gemini, with traffic, traffic change, keyword count and top keyword for each page. Run it on your own domain to check whether the pages winning visual search are also your strongest text pages. Then run it on a competitor to see which of their product and category pages carry the most traffic. If their best pages share an image style or layout yours lack, you've found your next test.
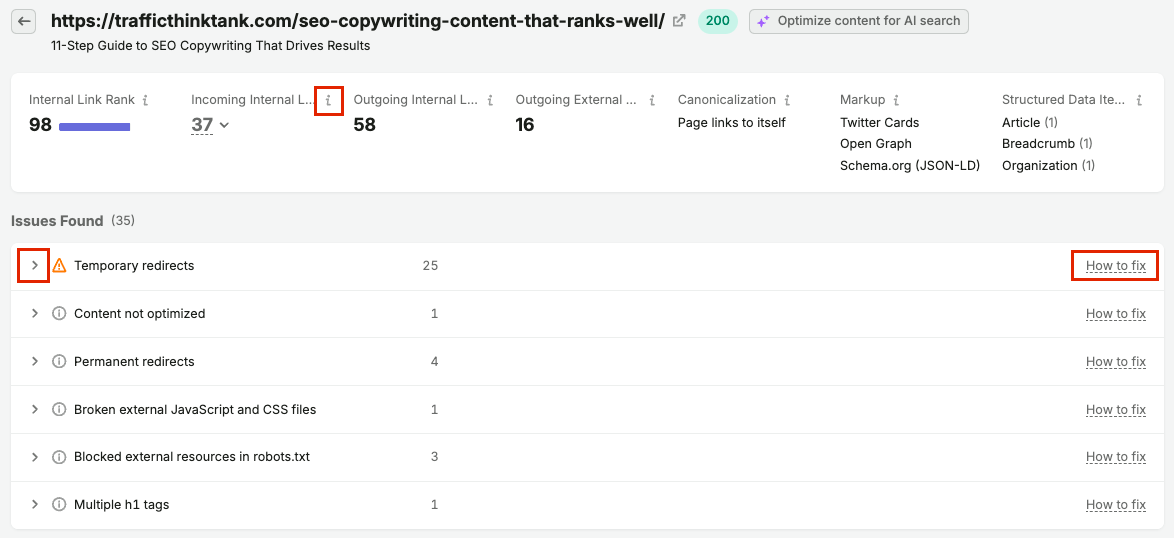
Site Audit checks that the pages earning visual traffic aren't held back by technical problems. Its Crawled Pages report lists every crawled URL with load time, markup and structured data, and the view for a single page lists each issue found on it with a How to fix note. Clear the errors on a template before you test new images on it, so a redirect chain or a slow load doesn't skew the result.
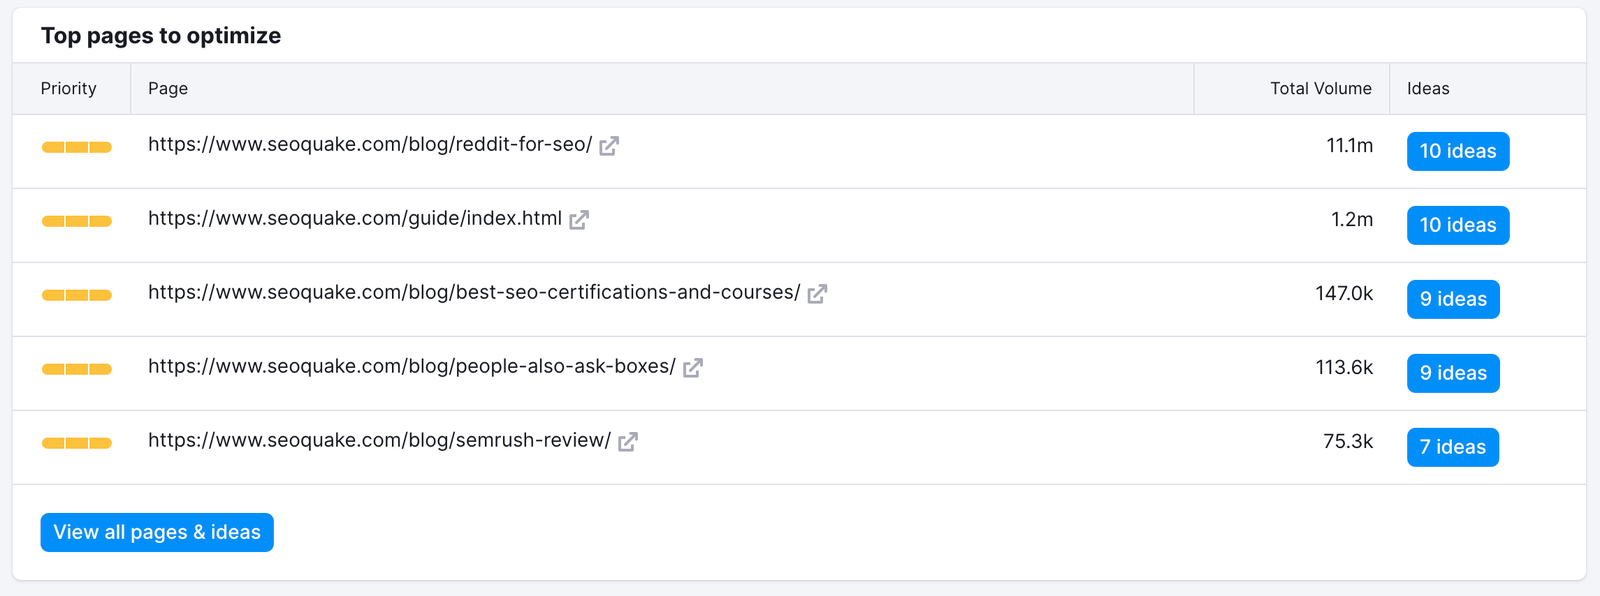
On Page SEO Checker turns "why does this page win?" into a task list. It compares each page against the top 10 organic competitors for its target keywords, suggests changes to content, semantics, SERP features and technical issues, and ranks the pages to optimize first by number of ideas, potential traffic and difficulty. Point it at the pages that do well in text search but show nothing in multimodal results, and you'll have a shortlist for your next round of image tests.
If people photograph what you sell, the multimodal filter finally puts a number on that channel, and Semrush One supplies the page-level context around it. To see which pages win visual search and what to fix on the ones that don't, start your Semrush One 7-day free trial, connect Search Console and run your first Site Audit before you change a single image.
Sources for this section
What to do with your multimodal data this month
- Export your Web: multimodal split now. The Search Analytics API has no multimodal type yet, so the report's Export button is the way to get the data out.
- Expect most of it to come from phones. In the one detailed public sample so far, 89% of multimodal impressions did.
- There are no queries, so start from the pages: what's on them, what someone likely photographed, and which similar pages get no visual traffic.
- Change images one template at a time and judge the change on multimodal clicks over several weeks.
- Treat every early benchmark, including the one in this article, as one site's data until more sites publish theirs.
Sources
Brian Weerasinghe is the founder and editor of AI Eating The World, where he covers artificial intelligence, tech companies, layoffs, startups, and the future of work. His reporting focuses on how AI is transforming businesses, products, and the global workforce. He writes about major developments across the AI industry, from enterprise adoption and funding trends to the real-world impact of automation and emerging technologies.